
Unlike other popular Machine Learning algorithms, there is not as much content on the Internet for beginners on General Regression Neural Network (GRNN). Wikipedia: https://lnkd.in/g2zktChp
I’ve built an Excel workbook to illustrate the idea of GRNN for those who are getting started. I hope this is helpful and I look forward to your comments.
What does a General Regression Neural Network (GRNN) do?
It is a function approximation that calculates the predicted ŷ from existing training data X and Y, letting the output of each training data sample contribute a certain weighted amount to the predicted ŷ. Once all training data are loaded, the prediction can be done simply by calculating the distance between input x and all the inputs in the training data X (x1, x2, x3,…, xi). Through an activation function, the distance turns into a weightage value that determines how much the corresponding yi contributes to ŷ.
Some experiments to try with the Excel:
1. Change training data. You can see that in the training data, Y is actually a simple calculation from X. This is good for illustration. Feel free to change the relationship between X and Y. For example, from Y = X+3 to Y = X+10 or Y = X*5. See how the model predicts ŷ accordingly.
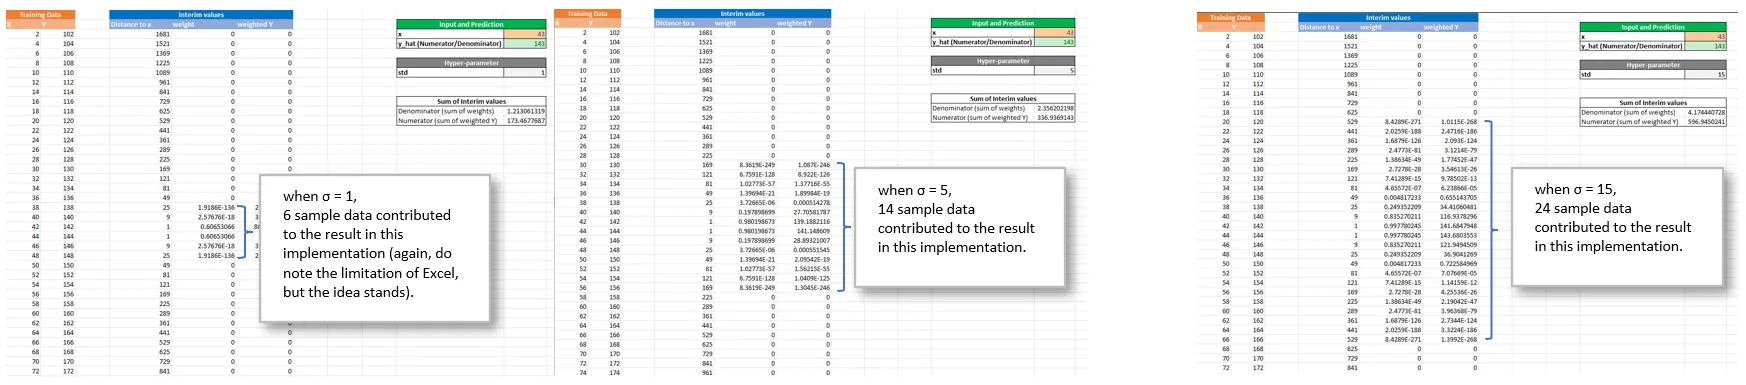
2. Play with the only hyperparameter in the model — std (σ). You can see that the bigger the value of σ, the more sample data are involved in contributing to the final result. Please note that Excel has a limit of precision to numerical values. When the numbers are small enough, they become 0. Note that the farther away from the input, the smaller the weight.
3. Special case — x is equal to one training data point. If your input x is the same as one of the training data, you can see the weight value becomes 1, and other weights are very small.

