This article explores how to perform video classification using CNN+RNN models. The use case here is to have a system to monitor the driver on the car, and check if the driver is drowsy or not. The complete system would include a device with camera that hosts the built model that can be installed on a car. The hardware deployment part is out of the scope of this article. If you are interested in it, feel free to put in comments. I’ll share the link to my code there. The focus of this article is video classification model building and comparison.
The nature of videos is a sequence a consecutive frames. When it comes to video classification or event recognition, it is often necessary to process multiple frames together to make sense of what is happening. This article use an approach that combines the image feature extraction of convolutions and temporal information processing of RNN. There can be different approaches. Initially, I started with ConvLSTM (Convolutional Long Short-Term Memory). However, I realised that the overall accuracy is low initially and it overfits. While I tried different methods to optimise the same model, I also explored further and tried LRCN (Long-term Recurrent Convolutional Network). LRCN produced better stability and there is much less sign of overfitting. It also trains faster. I’ll give an overview of both approaches before sharing the step-by-step code.
Approach 1: ConvLSTM (Convolutional Long Short-Term Memory)
This is an existing Keras class (ConvLSTM2D layer, n.d.) that can be used. The structure of ConvLSTM network is essentially the same as a typical LSTM. The difference is that inside each cell, the matrix multiplication between input and weights in the input, forget and output gates is changed to convolutions. This way, it can take image inputs directly, extracting the features inside the LSTM cells and feeding them to the next time step to be combined with the convolution result of the next input frame. There is a research paper that provided a good grasp of the concept and technical details (Medel, 2016).
The diagram below was drawn based on my understanding of the ConvLSTM model and our implementation in this project.

Approach 2: LRCN (Long-term Recurrent Convolutional Network)
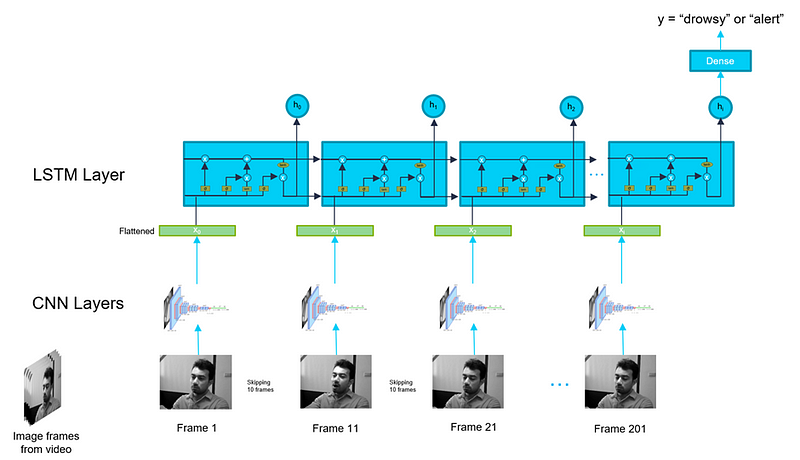
Compared to the ConvLSTM approach, it requires the image to be processed first before feeding into the LSTM cell. Compared to ConvLSTM, it does perform less rounds of convolution computation as what is fed into the input of LSTM is the flattened vector output from the earlier convolutional layers. The diagram below illustrates the architecture of the model.

One key difference between ConvLSTM and LRCN in input is that the inputs (x0, x1, x2…xt) in ConvLSTM are picture data directly while the input in LRCN are vectors as the result of CNN layers.
Data Acquisition and Preprocessing
To start with, we need to get the data needed for training. Fortunately enough, there is a good labelled dataset from National Tsing Hua University (Ching-Hua Weng, 2016). They were very kind and shared the data generously.

Each video is about 100 seconds long and there is a mixture of drowsy sections and alert sections. For example, one of the videos has the following frames:

As you can see that each video has frames of different classes. For model training, you need videos of the same type to the model for training. Therefore, the dataset cannot be used as-is. Therefore, I decided to make video clips of the same label (all “0” frames or “1” frames). The design is to build 10-second videos clips of the same type out of the given dataset. The assumption (human judgement) here is that a 10-second video is long enough to give good information to determine whether the driver is drowsy or not, while it is short enough to be processed with limited compute power.
Therefore, the training and testing data was produced by processing the videos obtained and made into 10-second clips. To do this, I developed a function based on OpenCV to read 10 seconds of frames (10s * 30 fps=300 frames) of the same label and save as a video file. Frame by frame, the corresponding label in the txt file is checked before it is saved. This makes sure the video clip is of the same type (drowsy or non-drowsy).
# Import opencv
import cv2
# Import operating sys
import os
# Import matplotlib
from matplotlib import pyplot as plt# Using batch to track videos
batch = 26# Establish capture object
cap = cv2.VideoCapture(os.path.join('data','sleepyCombination.avi'))

# Properties that can be useful later.
height = int(cap.get(cv2.CAP_PROP_FRAME_HEIGHT))
width = int(cap.get(cv2.CAP_PROP_FRAME_WIDTH))
fps = cap.get(cv2.CAP_PROP_FPS)
total_frames = cap.get(cv2.CAP_PROP_FRAME_COUNT)

#The length of each clip in seconds
num_sec = 10
# 1 for drowsy, 0 for alert.
capture_value = str(1)

# Open the Text File for tagging
with open(os.path.join('data','009_sleepyCombination_drowsiness.txt')) as f:
content = f.read()

# Helper counters.
# i tracking how many frames have been saved into clips
# j tracking where the current frame is.
i=0
j=0

# To make sure the number of labels is exactly the same as the number of frames before proceeding.
print(len(content))
print(total_frames)# Video Writer
# If there are still enough frames to be processed. Making the 1st video clip.
if j< total_frames - num_sec*fps:
video_writer = cv2.VideoWriter(os.path.join('data','class'+capture_value,'class'+capture_value + '_batch_'+str(batch)+'_video'+'1.avi'), cv2.VideoWriter_fourcc('P','I','M','1'), fps, (width, height))
# Loop through each frame
for frame_idx in range(int(cap.get(cv2.CAP_PROP_FRAME_COUNT))):
# Read frame
ret, frame = cap.read()
j+=1
# Show image
#cv2.imshow('Video Player', frame)

if ret==True:
if content[frame_idx] == capture_value:
# Write out frame
video_writer.write(frame)
i+=1
if i > num_sec*fps:
break
# Breaking out of the loop
if cv2.waitKey(10) & 0xFF == ord('q'):
break

# Release video writer
video_writer.release()# Making the 2nd clip
if j< total_frames - num_sec*fps:
video_writer = cv2.VideoWriter(os.path.join('data','class'+capture_value,'class'+capture_value+ '_batch_'+str(batch)+'_video'+'2.avi'), cv2.VideoWriter_fourcc('P','I','M','1'), fps, (width, height))
for frame_idx in range(i+1, int(cap.get(cv2.CAP_PROP_FRAME_COUNT))):
ret, frame = cap.read()
j+=1
#cv2.imshow('Video Player', frame)
if ret==True:
if content[frame_idx] == capture_value:
video_writer.write(frame)
i+=1
if i > 2*num_sec*fps:
break

# Release video writer
video_writer.release()

# Making the 3rd clip
if j< total_frames - num_sec*fps:
video_writer = cv2.VideoWriter(os.path.join('data','class'+capture_value,'class'+capture_value+ '_batch_'+str(batch)+'_video'+'3.avi'), cv2.VideoWriter_fourcc('P','I','M','1'), fps, (width, height))
for frame_idx in range(i+1, int(cap.get(cv2.CAP_PROP_FRAME_COUNT))):
ret, frame = cap.read()
j+=1
#cv2.imshow('Video Player', frame)
if ret==True:
if content[frame_idx] == capture_value:
video_writer.write(frame)
i+=1
if i > 3*num_sec*fps:
break
# Release video writer
video_writer.release()

### Continue making 4th, 5th..in the same way. Based on the data given,
### each video can be made into 8-9 clips.

# Close down everything at the end.
cap.release()
cv2.destroyAllWindows()
After preparation, we have the following set of videos for training and testing:

One thing important to mention here is about frame sampling. On a video that is 30 frames per second, if you take 20 consecutive frames, for example, it is less than 1 second of content. It does not contain sufficient information for inference. Each frame should look similar as well because in a car-driving setting, the changes are not drastic. Therefore, you can consider to do some down sampling. What I did was to take the 20 frames out of 200 frames, skipping 10 frames at each step, this captures 6–7 seconds of information and good enough to determine if the driver is drowsy or not. One key consideration of the design is also about the eventual deployment of the target solution. If we were to deploy the model on an edge device, what is a good number of frames that can be processed as one sequence. Based on the experiments with sample videos, 20 frames as one sequence is a good balance between sufficient information and the limited compute power. Just think about the nature of the type of videos we need to eventually. It is camera captures of drivers. This type of videos usually does not have drastic changes across frames. When a driver becomes drowsy, it is also a gradual change process. So, it is not critical to capture very single frame.
Model Building
The detailed model building code and explanation can be found in my other blog: https://medium.com/@junfeng142857/real-time-video-classification-using-cnn-rnn-5a4d3fe2b955
Iterations and findings
In the initial model, I tried feeding the entire 10-second video (300) frames into the model. This turned out too big for the compute power available to us. The biggest computer we are using is the one provided by Google Colab pro+ subscription which provides:
- RAM: 90GB
- GPU: NVIDIA-SMI 460.32.03; Driver Version: 460.32.03; CUDA Version: 11.2; GPU Memory size: 40GB
Even with the compute power above, the model was not able to train as it crashes the machine. Therefore, I decided to reduce the number of frames per sequence. This consideration is not just for training. We also need to consider eventual deployment which is on an edge device that has much less compute power. To decide what number of frames is good, I took the following factors into consideration:
- Deploy-ability. After quick deployment test on Raspberry Pi, a TensorFlow model with 20 frames per sequence can run at near full CPU. 40 frames and above had the risk of device failure.
- Model performance. I also compared how the number of frames per sequence impacts the model stability and accuracy, and noticed that 20 frames yields better accuracy than 40 frames across both approaches!
On top of the above, 20 frames per second also has a higher training speed. Therefore, it is good to keep the model at 20 frames per second.
In addition, through running iterations of training with both models, it was noticed that ConvLSTM has overall better accuracy at 20 frames per sequence, but LRCN has clear advantages.
- ConvLSTM has better test accuracy. In V1-40-frame, LRCN has a higher accuracy than ConvLSTM (ConvLSTM 70% vs LRCN 84%). In V2-20-frame training, LRCN has a lower accuracy (ConvLSTM 93% vs LRCN 84%). This shows that LRCN is more stable and ConvLSTM’s accuracy varies based on data. This difference can come from the complexity of the ConvLSTM model. Convolution is done at the input, forget and output gates. So longer sequence may give the model too much information to process so that it negatively impacted the performance.
- ConvLSTM also has higher tendency to overfit. Based on the training history, ConvLSTM has a higher tendency of overfitting. This should also be from the model complexity of ConvLSTM.
- LRCN has a higher training and inference speed. For a batch_size of 4, LRCN trains at 52 ms/step while ConvLSTM is at 884 ms/step.
To optimise the model, to following were also done during the training process.
- When preparing data, the data between the classes were balanced. There are the same number of videos in the dataset for each class.
- Dropout layers were added to the models. This helped reduce overfit.
Reference:
Video tutorials and documentations referenced:
- https://www.youtube.com/watch?v=QmtSkq3DYko&t=3371s
- https://www.youtube.com/watch?v=ezjnySXqdTo
- https://keras.io/api/layers/recurrent_layers/conv_lstm2d/
Dataset:
Ching-Hua Weng, Ying-Hsiu Lai, Shang-Hong Lai, Driver Drowsiness Detection via a Hierarchical Temporal Deep Belief Network, In Asian Conference on Computer Vision Workshop on Driver Drowsiness Detection from Video, Taipei, Taiwan, Nov. 2016
Literature Mentioned:
- Medel, J. R. (2016). Anomaly Detection Using Predictive Convolutional Long Short Term Memory Units . Rochester Institute of Technology.


